But at some point the graph will begin to curve, this is when an object reaches its elastic potential.
Thursday 21 February 2013
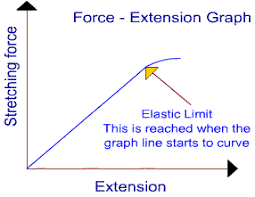
1.30 understand that the initial linear region of a force-extension graph is associated with Hooke’s law
A force extension graph shows how much a material stretches for the force applied. The initial linear region is the straight diagonal line showing a linear correlation between force and extension meaning that they increase at the same rate. This is Hooke's law.
But at some point the graph will begin to curve, this is when an object reaches its elastic potential.
But at some point the graph will begin to curve, this is when an object reaches its elastic potential.
Subscribe to:
Post Comments (Atom)
is the axis labelled wrong? i think the extension is supposed to be on the y-axis, and the force on the x. not sure but i think its that
ReplyDeleteI think it’s correct – check out BBC’s graph for more info: http://www.bbc.co.uk/schools/gcsebitesize/science/add_aqa/forces/forceselasticityrev2.shtml
Delete:)
more at https://kacrevision.blogspot.co.uk
ReplyDeleteThankkk yooouu! Very helpful, even in 2018!
ReplyDelete