Thursday 21 February 2013

1.36 understand that:  the universe is a large collection of billions of galaxies  a galaxy is a large collection of billions of stars  our solar system is in the Milky Way galaxy.

The universe contains many galaxies. Galaxies contain many stars, each star has a solar system. Our solar system is an a galaxy called the milky way.
This diagram sums up the order of the universe to give some sort of visual representation.


cosmology.net

1.34 describe the differences in the orbits of comets, moons and planets

They all have elliptical orbits.

Comets and planets go round a star; moons go round planets.

Comets have more elongated orbits.

1.32 understand gravitational field strength, g, and recall that it is different on other planets and the moon from that on the Earth

Gravitational field strength is how strongly something pulls an object towards it.
Earth has a higher gravitational field strength than the moon: on earth we are pulled down so much that we can jump only for a few seconds; on the moon the time you can jump for is longer as it is pulling you back in with a weaker gravitational field.
The reason for this difference is mass, the earth has more mass than the moon and so has a bigger gravitational field strength. Bigger planets than earth will have a higher gravitational field strength.

1.31 describe elastic behaviour as the ability of a material to recover its original shape after the forces causing deformation have been removed.

Elastic behaviour is the way that when you stretch an object with this behaviour it will return to its origional shape after the forces stretching it stop stretching it. Eg when you stretch an elastic band and then let go it pings back to regains its original shape and size.
Note that if you stretch an elastic band to far it won't go back? this is because it as reached its elastic limit which, beyond this point, means it looses its elastic behaviour.

1.30 understand that the initial linear region of a force-extension graph is associated with Hooke’s law

A force extension graph shows how much a material stretches for the force applied. The initial linear region is the straight diagonal line showing a linear correlation between force and extension  meaning that they increase at the same rate. This is Hooke's law.
But at some point the graph will begin to curve, this is when an object reaches its elastic potential.

1.29 describe experiments to investigate how extension varies with applied force for helical springs, metal wires and rubber bands

The most common experiment for this goes like so:

  • Attach a spring to a newton meter and measure its length
  • Add a 50g weight and measure again
  • continue to add another weight and take another measurement
  • Do this up to 400g
by plotting a graph from the results from this you can see the extension increases with force; as each time a weight is added the spring gets longer.

1.28 understand that the upward forces on a light beam, supported at its ends, vary with the position of a heavy object placed on the beam

This means you need to understand that if you have say a plank of wood being held in balance by springs pushing up at the ends and you put a weight on the beam, the springs would have to exert more force as they need to equal the downward force.

In this diagram the up wards and downwards forces are the same. If a 10N weight were to be placed to the beam the trestles would have to increase their upwards force by 10N

1.27 know and use the principle of moments for a simple system of parallel forces acting in one plane

This criterion means you need to be able to manipulate the moments equation to do questions about forces that are acting on a straight line. It is important to remember that if the straight line is balanced then the clockwise and anti-clockwise moments will be exactly the same. Moment= force x distance.

For example:

C is the pivot of this straight line
The anti-clockwise moment is force x distance= 7n x 5m= 35
As the line is balanced we know that the anti-clockwise moment is also 35
Now we can rearrange the equation to give us the distance in the clockwise moment: distance= moment/force
35/4= 8.75m
So Dm= 8.75m

(nb 5N and DN on diagram are 5m and dm)

1.25 know and use the relationship between the moment of a force and its distance from the pivot: moment = force × perpendicular distance from the pivot

An object turned around a pivot when force is applied is a moment.
The equation of a moments is: moment= force x distance from pivot

For example if a 3N weight is placed 4M away from a pivot there will be a moment of 12NM

The equation can be rearranged to solve questions:
revision-systems.co.uk

1.24 demonstrate an understanding of Newton’s third law

Most commonly put a 'each force has an equal and opposite force' the principle of this law is that two bodies interacting are both exerting a force on each other.
The most simple example of this is that when you sit on a chair you are exerting a downward force on the chair, but the chair is also pushing back up at you (or you would be sinking into the ground.) Another example is that when you swim you push the water backwards which pushes you forward.

1.23 use the relationship between force, change in momentum and time taken

This is more fully explained in 1.21 but:
force= change in momentum / time taken

1.22 use the conservation of momentum to calculate the mass, velocity or momentum of objects

Momentum= mass x velocity
Velocity= momentum / mass
Mass= momentum / velocity

If a bullet with a mass of 0.2g is shot from a gun at 100 m/s/s to work out its momentum we do 0.2g x 100 m/s = 20 g m/s.

1.21 use the idea of momentum to explain safety features

force felt= change in momentum/time

If the time taken for momentum to change is increased, the overall force felt is decreased.
Crumple zones in cars increase the time it takes for the cars momentum to reach zero, meaning passengers feel less of the force. Air bags do the same thing; increasing the time till momentum of a body reaches zero reduces the force felt.

To understand if you jump with you knees locked you can feel more of the force. If when you hit the ground you bend your knees the landing is softer as you feel less force. This happens because when you finish by bending your knees you take more time to reach zero momentum therefore reducing the force felt.

1.20 know and use the relationship between momentum, mass and velocity


momentum = mass × velocity

p = m × v

1.19 describe the factors affecting vehicle stopping distance including speed, mass, road condition and reaction time

Stopping distance is thinking distance and braking distance added together, things that effect this are:
  • The condition of the driver; drugs/ tiredness (thinking distance)
  • How worn the brakes/ tyres are
  • If the weather conditions are poor
  • How heavy the car is
  • The speed the car is travelling at

1.18 describe experiments to investigate the forces acting on falling objects, such as sycamore seeds or parachutes

Dropping parachutes from a given height; this shows us that gravity is acting on them. By increasing the size of the parachute and recording the results we can see that air resistance also has an effect on falling objects; plotting a graph should reveal that bigger surface area takes more time, from which we can infer that air resistance acts on the falling objects.

1.7 determine acceleration from the gradient of a velocity-time graph

Acceleration is measured in meters per second per second: m/s/s or m/s².
This means we need to find out how many m/s are travelled every s.
Which  is the same as change in velocity over time.
We can work this out by looking at a time period in the graph and seeing how much the velocity changes. For example on this graph between second 3 and second 4 the velocity changes from 0 to 4: meaning that it changes 4 m/s every 1s
4/1= 4m/s²
So effectively you do up divided by across to give acceleration.
Velocity-time graph. Velocity in metres/second is on the vertical (y) axis and time in seconds in on the horizontal (x) axis. The line goes straight from 0 to 3 seconds on the x axis. the the object speeds up and it's velocity increases from 0 to 8 m/s in 2 seconds. The speed remains constant at 8 m/s for 3 seconds, before decreasing back to 0 in 2 seconds.(bbc)

1.6 plot and interpret velocity-time graphs

Plotting

On the Y axis of a distance time graph is velocity- speed travelled in a give direction. On the X axis is time taken from start. Note that negative velocities mean something is travelling in the opposite direction to that of the positive velocity.

Interpreting
A line going diagonally upwards shows an acceleration, if it is straight it is a constant acceleration. This is because acceleration is change in velocity over time.
A line going diagonally down wards shows a deceleration. A straight downwards line shows constant deceleration. Again deceleration is change velocity over time but the velocity is decreasing.
The steeper the line the more rapid the acceleration because the velocity us changing over less time.
A straight line is a constant velocity: you are travelling at one speed in one direction.


(maths revision.net)

1.4 describe experiments to investigate the motion of everyday objects such as toy cars or tennis balls

You could plot the time it takes for a toy car to travel and then plot a distance time graph. Then repeat at different speeds and compare the different graphs.

Alternatively, you could use a ticker tape; this makes a mark every second on the tape. If you attach the car to the end of the tape, its speed will be recorded: distance/dots = speed. For example, if you has 50 dots on a meter tape then it traveled at an average speed of (1/50) 0.02 meters per second.

Tuesday 19 February 2013

1.17 describe the forces acting on falling objects and explain why falling objects reach a terminal velocity

When first an object is falling it is accelerating- the force acting downward (gravity) is larger than the force acting upwards (air resistance.) But when air resistance and gravity become equal the object will have reached its maximum speed; its terminal velocity.

1.16 know and use the relationship between weight, mass and g


weight = mass × g
W = m × g

1.15 know and use the relationship between unbalanced force, mass and acceleration


force = mass × acceleration
F = m × a

1.14 understand that friction is a force that opposes motion

Friction is a force that acts in the opposite direction to motion.

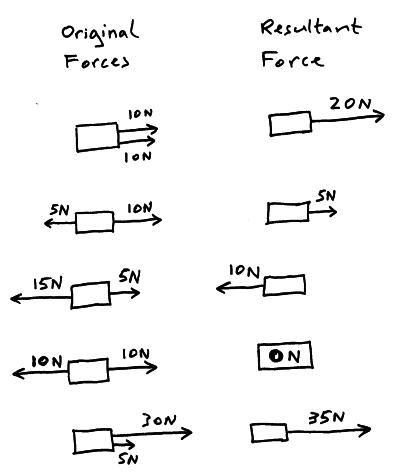
1.13 find the resultant force of forces that act along a line

Resultant force is the overall force acting in a direction on an object. It is best explained by digrams which show that the resulatnt force is the overall force given individual forces acting along a line.

1.12 understand that force is a vector quantity

Force has magnitude, it is measured in newtons but it acts in a direction.
For example 3N drag
is an amount of force acting backwards.

1.11 distinguish between vector and scalar quantities

Vector 
Has magnitude and a direction. For example velocity is a speed in a given direction.

Scalar
Has a magnitude. For example speed.

1.10 identify different types of force such as gravitational or electrostatic

Different forces include:
Gravity; acting downwards
Up thrust; acting upwards
Drag; acting against the movement

Learn the direction that forces act in and you will be able to forfill this criteria

1.9 describe the effects of forces between bodies such as changes in speed, shape or direction

Changes in speed
When an object is stationary it has an equal force pushing down and up. The downward force being gravity and the upward force being the surface the object is on. The object is not floating but it is not going into the ground.

When an object is accelerating it has the upwards and downwards forces but it also has forwards and backwards forces (drag and friction). The forward force is larger than the backward force when an object is accelerating.

When an object is going at a constant speed it has downward and upward forces as well as forward and backward forces. The forward and backward forces are equal, so the speed doesn't change even though the object is moving.

When an object is decelerating it has the equal upward and downward forces as well as forward and backward forces, but the backward force is larger than the forward one, slowing the object down.

Changes in shape
changes in shape affect momentum. Force= change in momentum/ time taken. An example of this is crumple zones in car decrease the force on the passengers.

Changes in direction
Which ever direction the force is greatest in will be the direction the object travels in.

Monday 18 February 2013

1.8 determine the distance travelled from the area between a velocity-time graph and the time axis


Distance can be calculated by finding the area between the velocity time graph (line) and the time axis. If you look there is a shape formed between the two lines, find the area of this using the measure given on the sides
e.gThe width of the triangle is 4 seconds and the height is 8 metres per second. to find the area  of a triangle is 1/2 x base x height so 1/2 x 8 x 4= 16
The width of the rectangle i
s 6 seconds and the height is 8 metres per second. So the area is 8 × 6 = 48 m. Making the overall area 16 + 48 = 64 m.
(BBC bitesize)

Tuesday 12 February 2013

1.3 know and use the relationship between average speed, distance moved and time


Average speed= Distance moved / time taken

1.2 plot and interpret distance-time graphs

A distance time graph is a graph showing the relationship between distance travelled and time taken.

Drawing a distance time graph
The Y axis should be the distance travelled from the start, meaning the bottom is time.
To plot simply mark the distance travelled at every chosen point of time: e.g every second.

Interpreting distance time graphs
A horizontal line is a stationary object: because time is still going forward but the object is not moving up or down the distance axis.
A line upwards is a object moving away from the start; a downward line is a object moving towards the start.
The steeper the line the faster the object: its doing more distance for time- more up for across.
To get a speed see how much up it goes for across. (the graph on the link below goes two up for one across  that's two meters per second (2m/s))

The video on this page is insanely helpful: http://www.bbc.co.uk/schools/gcsebitesize/science/add_ocr_pre_2011/explaining_motion/describingmotionrev2.shtml

1.1 use the following units: kilogram (kg), metre (m), metre/second (m/s), metre/second2 (m/s2), newton (N), second (s), newton per kilogram (N/kg), kilogram metre/second (kg m/s).


Bit of a self explanatory one here, but I thought of some things to say:

kilogram (kg)- the metric way of measuring weight; a standard bag of sugar is 1kg

metre (m)- the metric measure for distance; about one stride

metre/second (m/s)- this is a measure of speed; it is how many meters you go in a second

metre/second2 (m/s2)- this is a measure of acceleration, which is how quickly speed changes

newton (N)- a newton is a measure of force

second (s)- a second is how long it takes to say Mississippi (not scientific definition!) 

newton per kilogram (N/kg)- how much force for every kilogram of weight